A Gabor Feature-based Quality Assessment Model for the Screen Content Images
Abstract
In this paper, an accurate and efficient full-reference image quality assessment (IQA) model using the extracted Gabor features, called Gabor feature-based model (GFM), is proposed for conducting objective evaluation of screen content images (SCIs). It is well-known that the Gabor filters are highly consistent with the response of the human visual system (HVS), and the HVS is highly sensitive to the edge information. Based on these facts, the imaginary part of the Gabor filter that has odd symmetry and yields edge detection is exploited to the luminance of the reference and distorted SCI for extracting their Gabor features, respectively. The local similarities of the extracted Gabor features and two chrominance components, recorded in the LMN color space, are then measured independently. Finally, the Gabor feature pooling strategy is employed to combine these measurements and generate the final evaluation score. Experimental simulation results obtained from two large SCI databases have shown that the proposed GFM model not only yields a higher consistency with the human perception on the assessment of SCIs but also requires a lower computational complexity, compared with that of classical and state-of-the-art IQA models.
Gabor feature-based model for SCI Quality Assessment
Experimental Results
|
Table. 1. Performance Comparison of Different IQA models on the SIQAD and SCID databases. 
|
Table 1 lists the overall performances of various IQA models on the SIQAD and the SCID databases, respectively. In this table, the firstranked, the second-ranked, and the third-ranked performance figures of each measurement criterion (i.e., PLCC, SROCC, KROCC, or RMSE) are boldfaced in red, blue, and black, respectively. Note that the program codes of all the models under comparison are downloaded from their original sources, except for two SCI ones (i.e., SPQA and SQI). Therefore, the results of SPQA and SQI on the SCID database and some particular results of SPQA and SQI on the SIQAD database (e.g., KROCC of SPQA, KROCC of SQI, RMSE of SQI on each distortion type) are not available. From Table 1, one can see that the proposed GFM yields the best overall performance in terms of PLCC, SROCC, KROCC, and RMSE on SCID database, compared with other state-of-the-art FR-IQA models. On the SIQAD database, the proposed GFM obtains third-place overall performance but almost comparable to the top two models—SQMS and SVQI.
|
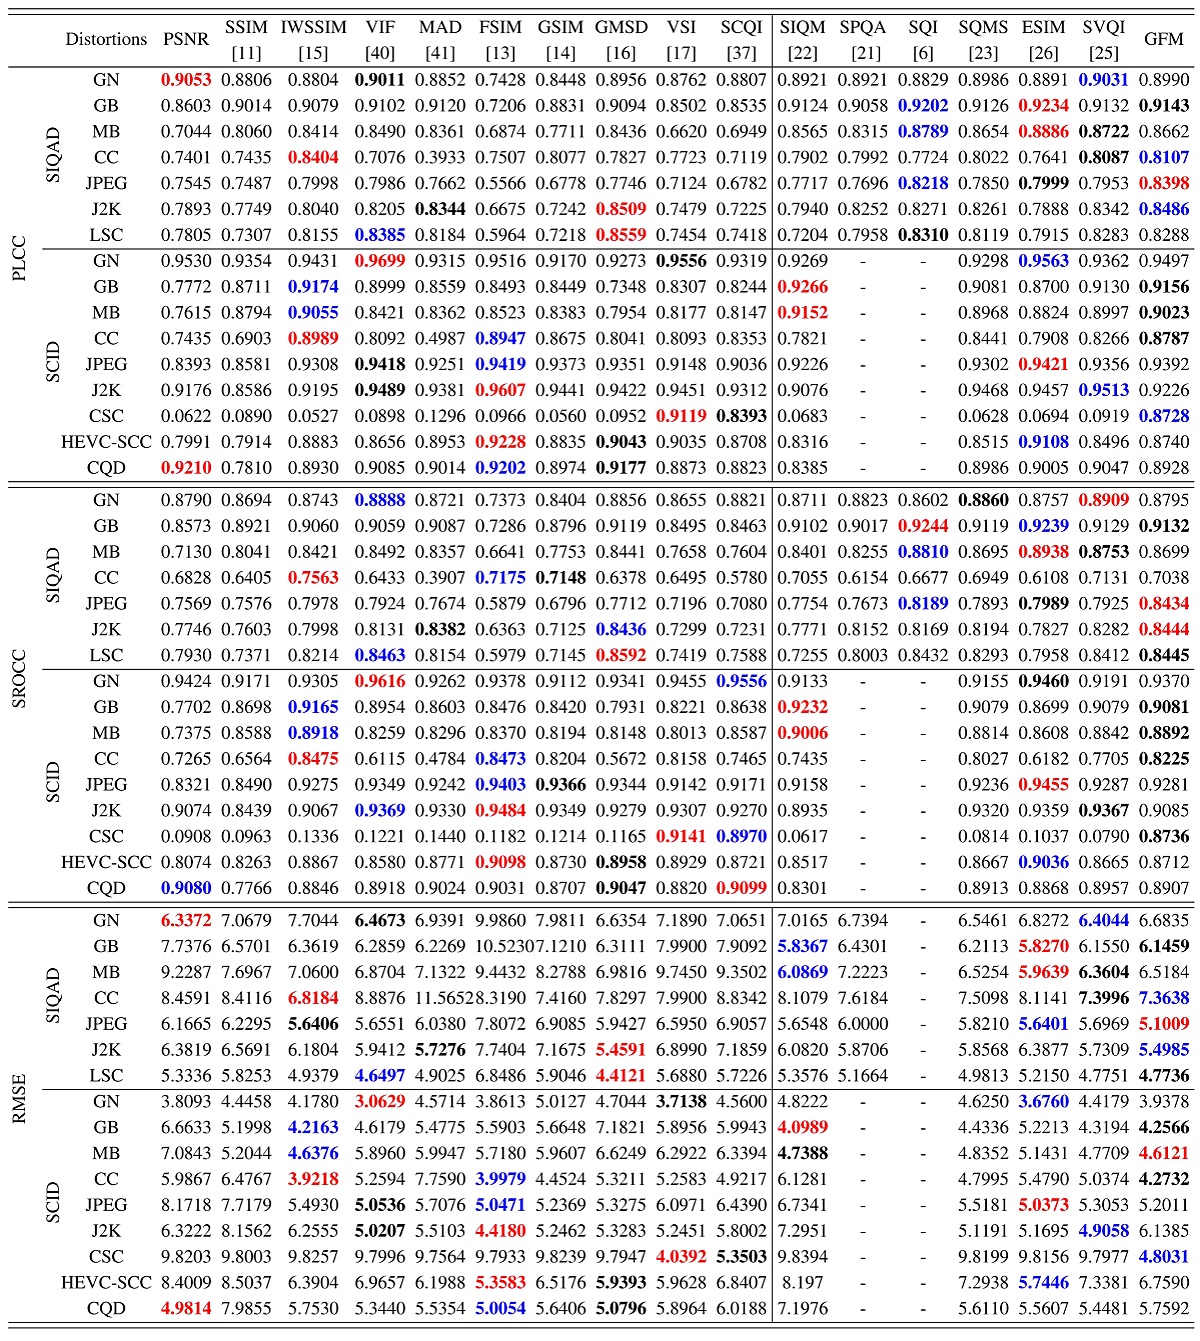
Table. 2. PLCC, SROCC, and RMSE comparison of various IQA models under different distortion types on the SIQAD and SCID datasets. 
|
To more comprehensively evaluate the ability of each IQA model on assessing image quality’s degradations caused by each distortion type, Table 2 reports the results that are measured in PLCC, SROCC and RMSE, respectively. And all these experiments are conducted on the SIQAD and the SCID databases. In each row of this table, the first-, second- and third-ranked performance figures are highlighted in red, blue and black bold, respectively, for ease of comparison. It can be observed that the proposed GFM yields the most top-three performances compared with other IQA models. Specifically, in the comparisons in terms of SROCC, it can be seen that the proposed GFM is among the top-three models 8 times, followed by ESIM and FSIM, which are among the topthree performances 6 times and 5 times, respectively. In the comparisons in terms of PLCC, the proposed GFM is among the top-three models 8 times, followed by ESIM (6 times), VIF (5 times), and FSIM (5 times). In the comparisons in terms of RMSE, the proposed GFM is among the top-three models 9 times, followed by ESIM (6 times), VIF (5 times), FSIM (5 times), and IWSSIM (5 times). Moreover, one can see that the proposed GFM is more capable in dealing with the distortions of Gaussian blur (GB), and JPEG compression. This is because the distortions or artifacts yielded by blurring and compression will inevitably degrade the image’s structure and make significant changes on the extracted structural information. The Gabor features generated in our proposed GFM model can accurately reflect the distortions and therefore make proper assessment.
|
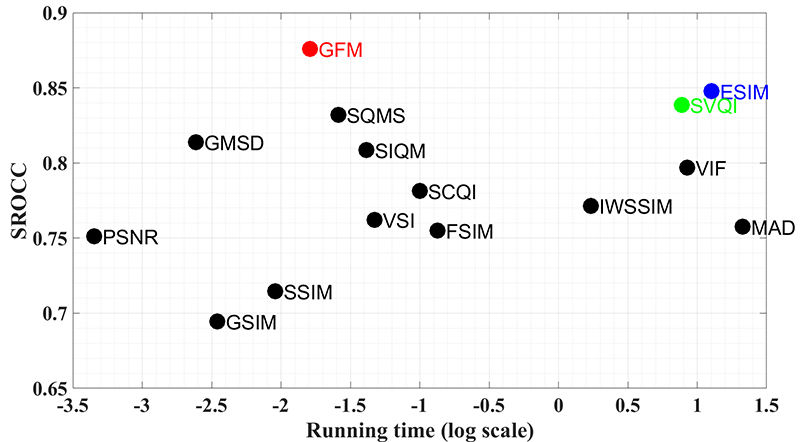
Computational Complexity Comparison: In addition to the accuracy, the computational complexity of the IQA model is another figure of merit that needs to be assessed, especially for practical applications. For that, the average running time per image incurred for each IQA model by experimenting on the SCID database (1,800 distorted SCIs with a resolution of 1280×720 for each image) is measured to evaluate its computational complexity. The computer used is equipped with an Intel I5-4590 CPU@3.30GHz with 8GBs of RAM, and the software platform is Matlab R2014b. Note that all the source codes of competing IQA models are obtained from their authors or websites and are performed under the same test procedure and environment to have a meaningful and fair comparison. The run-time results are documented in Fig. 2. It can be observed that the proposed GFM model requires a relatively low computational complexity. Although the PSNR, SSIM, GSIM, and GMSD are faster than the proposed GFM model, their accuracy measurements are much inferior to ours, as they cannot accurately describe the perceptual quality of the SCIs. Among the IQA models with top-four performances (i.e., GFM, SVQI, ESIM, and SQMS), the proposed GFM requires the least amount of computational time, while delivering fairly high accuracy. |

Fig. 2. SROCC VS. running time of various IQA models on SCID dataset. |
Download
If you use the code in your research, we kindly ask that you reference this website and our paper listed below.
Zhangkai Ni, Huanqiang Zeng, Lin Ma, Junhui Hou, Jing Chen, and Kai-Kuang Ma, "A Gabor Feature-based Quality Assessment Model for the Screen Content Images," IEEE Transactions on Image Processing, vol. 27, no. 9, pp. 4516-4528, Sep. 2018. Paper | Code | BibTex
@article{ni2018gabor,
	title={A Gabor feature-based quality assessment model for the screen content images},
	author={Ni, Zhangkai and Zeng, Huanqiang and Ma, Lin and Hou, Junhui and Chen, Jing and Ma, Kai-Kuang},
	journal={IEEE Transactions on Image Processing},
	volume={27},
	number={9},
	pages={4516--4528},
	year={2018},
	publisher={IEEE}
}
References
|
GFM
|
|
|
SSIM
|
Z. Wang, A. C. Bovik, H. R. Sheikh, and E. P.
Simoncelli, "Image Quality Assessment: From Error Visibility to
Structural Similarity," IEEE
Transactions on Image Processing, vol. 13, no. 4, pp.
600-612, Apr. 2004.
Paper
|
|
IWSSIM
|
Z. Wang, Q. Li, "Information Content Weighting for
Perceptual Image Quality Assessment,"
IEEE Transactions on Image Processing, vol. 20, no. 5, pp.
1185-1198, Apri. 2011.
Paper
|
|
VIF
|
H. R. Sheikh, A. C. Bovik, "Image Information and
Visual Quality," IEEE Transactions on
Image Processing, vol. 15, no. 2, pp. 430-444, Feb. 2006.
Paper
|
|
MAD
|
E. C. Larson, D. M. Chandler, "Most Apparent
Distortion: Full-Reference Image Quality Assessment and the Role of
Strategy," Journal of Electronic Imaging
, vol. 19, no. 1, Jan. 2010.
Paper
|
|
FSIM
|
L. Zhang, L. Zhang, X. Mou, and D. Zhang, "FSIM: A
Feature Similarity Index for Image Quality Assessment," IEEE Transactions on Image Processing
, vol. 20, no. 8, pp. 2378-2386, Aug. 2011.
Paper
|
|
GSIM
|
A. Liu, W. Lin, and M. Narwaria, "Image Quality
Assessment Based on Gradient Similarity," IEEE Transactions on Image Processing
, vol. 21, no. 4, pp. 1500-1512, Apr. 2012.
Paper
|
|
GMSD
|
W. Xue, L. Zhang, X. Mou, and A. C. Bovik, "Gradient
Magnitude Similarity Deviation: A Highly Efficient Perceptual Image
Quality Index," IEEE Transactions on
Image Processing, vol. 23, no. 2, pp. 684-695, Feb. 2014.
Paper
|
|
VSI
|
L. Zhang, Y. Shen, and H. Li, "VSI: A Visual
Saliency-Induced Index for Perceptual Image Quality Assessment," IEEE Transactions on Image Processing
, vol. 23, no. 10, pp. 4270-4281, Oct. 2014.
Paper
|
SIQM |
K. Gu, S. Wang, G. Zhai, S. Ma, and W. Lin, "Screen Image Quality Assessment Incorporating Structural Degradation Measurement," IEEE International Symposium on Circuits and Systems, pp. 125-128, May 2015. Paper |
|
SPQA
|
|
SQI |
S. Wang, K. Gu, K. Zeng, Z. Wang, and W. Lin, "Objective quality assessment and perceptual compression of screen content images," IEEE Computer Graphics and Applications, vol. 38, no. 1, pp. 47-58, May 2016. Paper |
SQMS |
K. Gu, S. Wang, H. Yang, W. Lin, G. Zhai, X. Yang, and W. Zhang, "Saliency-guided quality assessment of screen content images," IEEE Transactions on Multimedia, vol. 18, no. 6, pp. 1098-1110, March 2016. Paper |
ESIM |
Z. Ni, L. Ma, H. Zeng, J. Chen, C. Cai, and K.-K. Ma, "ESIM: Edge Similarity for Screen Content Image Quality Assessment," IEEE Transactions on Image Processing, vol. 26, no. 10, pp. 4818-4831, June 2017. Paper |
SVQI |
K. Gu, J. Qiao, X. Min, G. Yue, W. Lin, and D. Thalmann, "Evaluating quality of screen content images via structural variation analysis," IEEE Transactions on Visualization and Computer Graphics, vol. 24, no. 10, pp. 2689-2701, November 2017. Paper |
|
SIQAD
|
|
ESIM |
Contact
If you have any questions, please feel free to contact Dr. Zhangkai Ni .
Last update: Oct. 7, 2018
