ESIM: Edge Similarity for Screen Content Image Quality Assessment
Zhangkai Ni1, Lin Ma2, Huanqiang Zeng1, Jing Chen1, Canhui Cai1, and Kai-Kuang Ma3
1School of Information Science and Engineering, Huaqiao University, Fujian, China
2Tencent AI Lab, Shenzhen
3School of Electrical and Electronic Engineering, Nanyang Technological University, Singapore
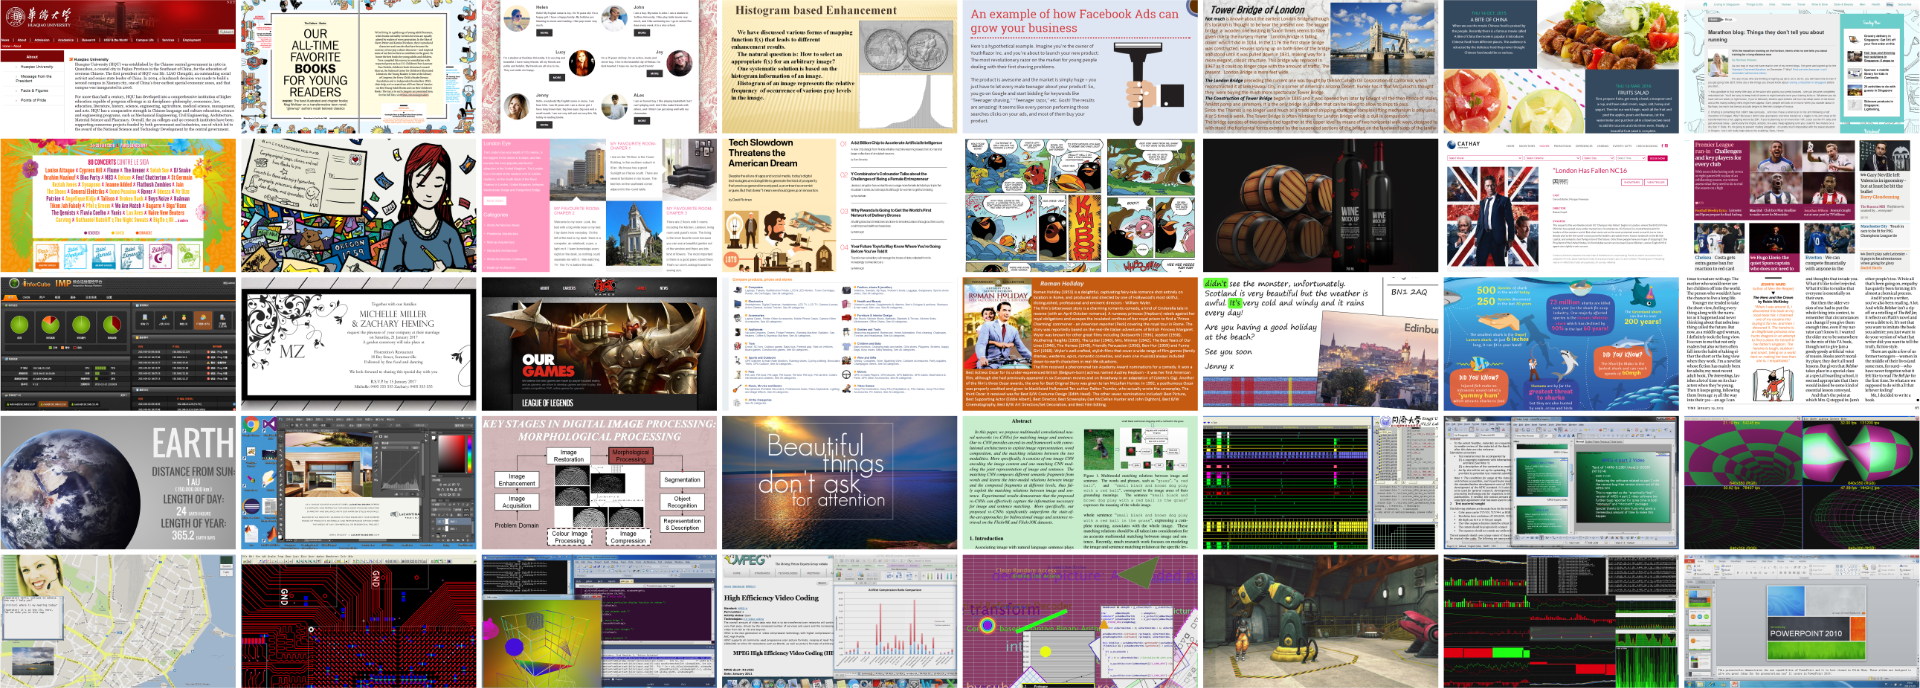
Fig. 1. Samples of the reference SCIs utilized in the SCID. |
SCID: Screen Content Image Database
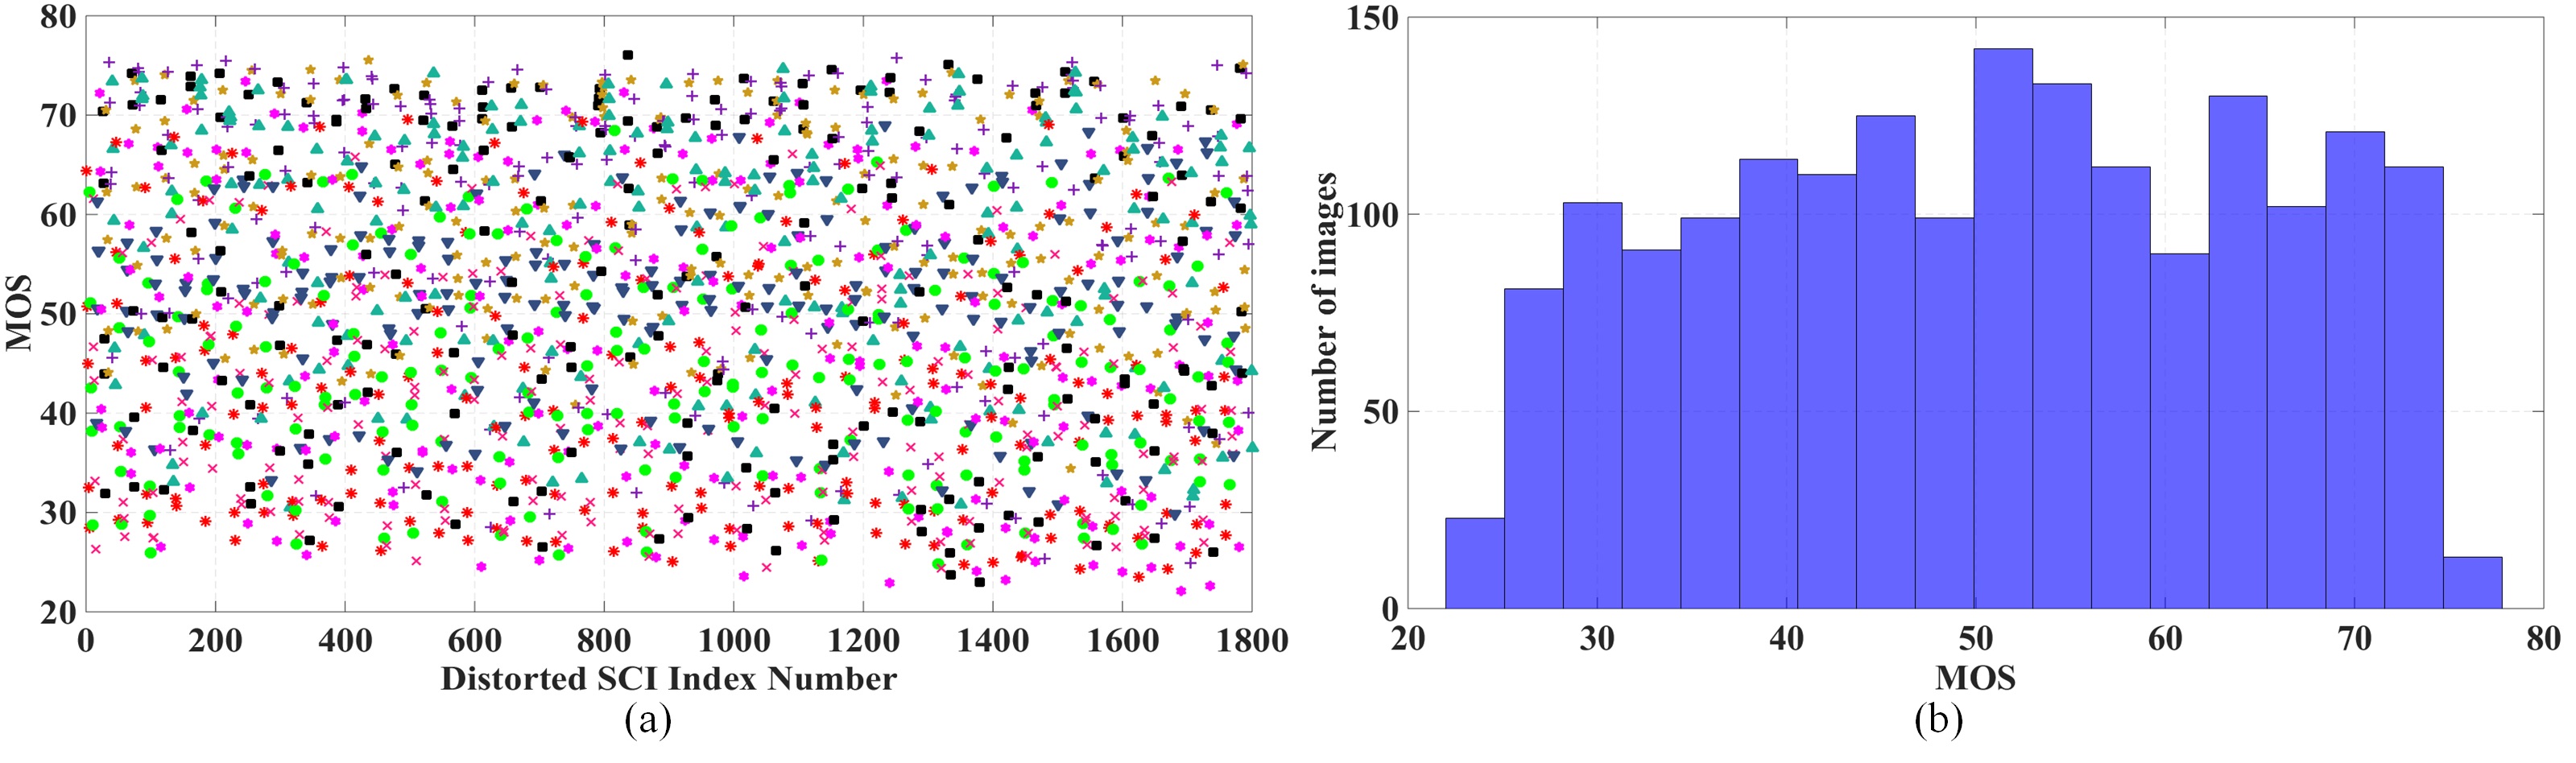
Fig. 2. The profiles of the obtained MOS in our established SCID: (a) Scatter plot of the entire 1,800 distorted SCIs and their MOS values; (b) Histogram of the MOS values of the entire 1,800 distorted SCIs. |
In our proposed SCI database (denoted as SCID), both the reference SCIs and their distorted versions are included. For the former, extensive effort on searching representative SCIs over the Internet have been conducted through large manpower. With thoughtful evaluations, 40 images were selected from several hundreds of collected SCIs as the reference6 SCIs, as they cover a wide variety of combinations on various image contents, including texts, graphics, symbols, patterns, and natural images. The sources of these SCIs could come from web pages, PDF files, power-point slides, comics, digital magazines through screen snapshot, and so on. All of them are cropped to a fixed size, with the resolution of 1280 x 720. To conduct the performance evaluation of our proposed ESIM model, a new and the largest SCI database (denoted as SCID) is established in our work and made to the public for download. Our database contains 1,800 distorted SCIs that are generated from 40 reference SCIs. For each SCI, 9 distortion types are investigated, and 5 degradation levels are produced for each distortion type.
ESIM: Edge-SIMilarity based IQA model for SCI
|
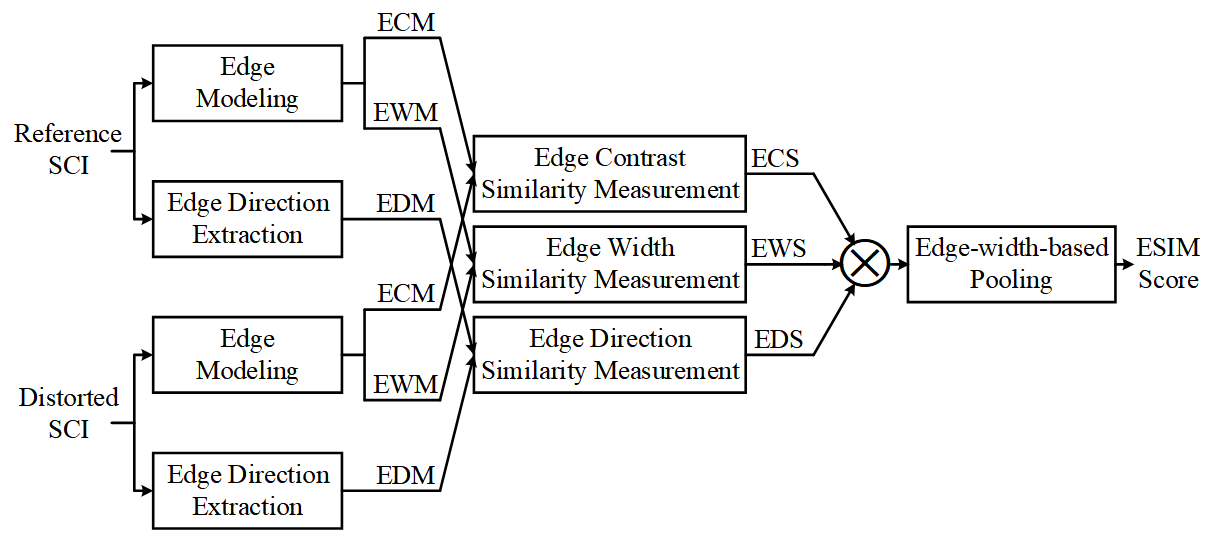
Fig. 3. The framework of our proposed ESIM for SCI.
The proposed IQA model, edge similarity (ESIM), is used for conducting an objective image quality evaluation of a given distorted SCI, with respect to its reference SCI. The flowchart of the proposed ESIM algorithm is shown in Fig. 3, which consists of three processing stages. In the first stage, a parametric edge model is used to extract two salient edge attributes, edge contrast and edge width. As a result, the extracted edge contrast and edge width information are expressed in terms of maps---i.e., the edge contrast map (ECM) and the edge width map (EWM), respectively. In addition, the edge direction is considered and incorporated into our proposed IQA model. The edge direction map (EDM) will be generated directly from each SCI via our proposed edge direction computation method. In the second stage, the computed edge feature maps, one from the reference SCI and the other from the distorted SCI, will be compared to yield their edge similarity measurement. For example, the two ECMs, respectively obtained from the distorted SCI and the reference SCI, will be compared to arrive at the edge contrast similarity (ECS) map. Likewise, the edge width similarity (EWS) map and edge direction similarity (EDS) map will be generated based on the corresponding pair of EWMs and EDMs, respectively. The three generated similarity measurement maps will be combined to yield one measurement map, which is used as the input of the third, and the last, stage to compute the final ESIM score using our proposed edge-width-based pooling process.
Experimental Results
|
Table. 1. Performance Comparison of Different IQA models on our Established SCID Database. 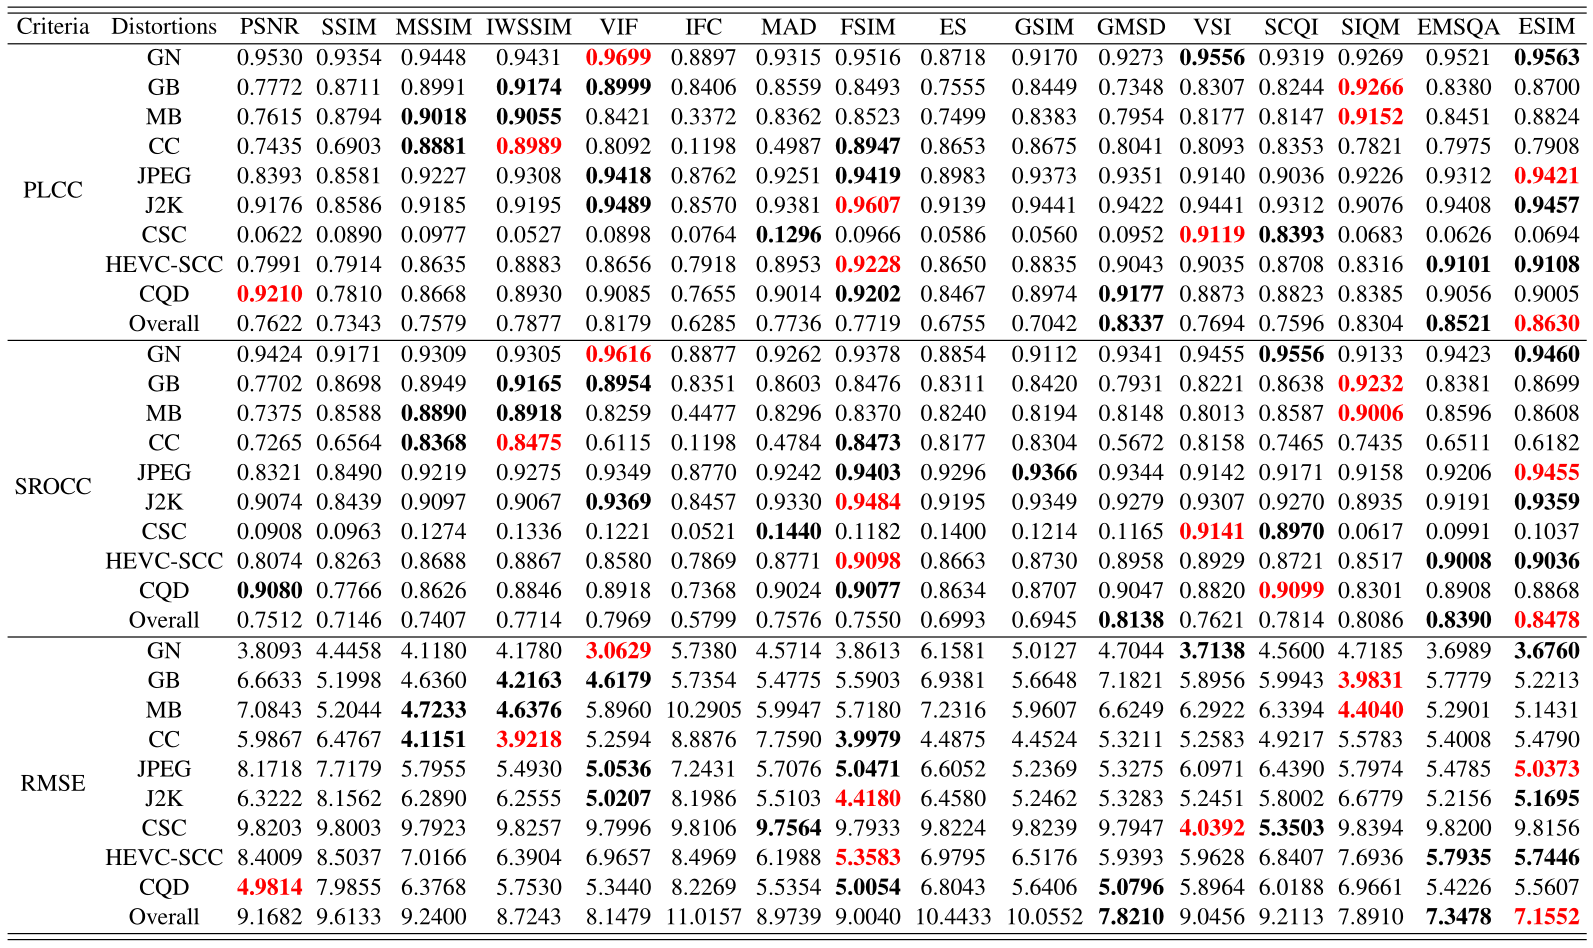
|
From the experimental results documented in Fig 4, one can see that the proposed ESIM model outperforms all the state-of-the-art models under comparison, as it is able to achieve the highest correlation or consistency with the subjective quality ratings judged by the HVS. Note that the proposed ESIM model also significantly outperforms other state-of-the-art edge-based IQA models; i.e., ES, GSIM, and GMSD. This reveals that the proposed ESIM model that exploits three edge attributes (i.e., edge width, edge contrast, and edge direction) is much more effective to explore the edge information for conducting SCI perceptual quality assessment. Another interesting observation is that all the models specifically designed for the SCI quality assessment (i.e., SIQM, SPQA, SQI, EMSQA, and our proposed ESIM) can achieve better performance than those IQA models developed for the naturalimages in SIQAD database. This is mainly due to the fact that they consider the special characteristics of the SCI on the design of SCI quality assessment models.
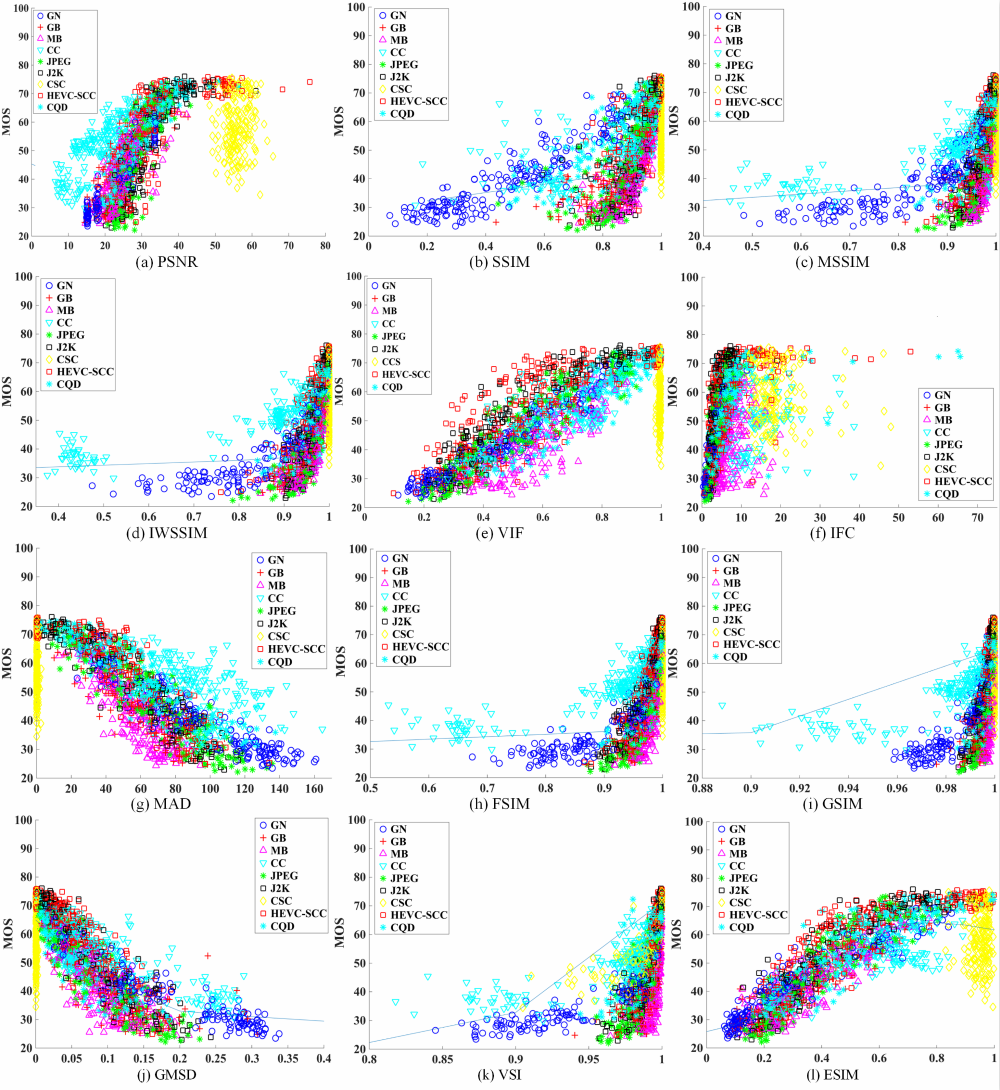
Fig. 4. Scatter plots of the MOS versus the IQA metrics using our established SCID database: (a) PSNR; (b) SSIM; (c) MSSIM; (d) IWSSIM; (e) VIF; (f) IFC; (g) MAD; (h) FSIM; (i) GSIM; (j) GMSD; (k) VSI; and (l) Proposed ESIM, respectively. The blue-color line as shown in each sub-plot is obtained by using a curve fitting procedure according to (20). One can see that the data points on the scatter plot of the proposed ESIM are much closer to this curve (thus, a better fitting to the curve). |
To further visualize the performance yielded by the IQA models under comparison, Fig. 4 shows the scatter plots of the subjective scores against the objective scores as predicted by some representative IQA models (i.e., PSNR, SSIM, MSSIM, IWSSIM, VIF, IFC, MAD, FSIM, GSIM, GMSD, VSI, and the proposed ESIM) based on our SCID database for a demonstration. The curve as shown in each sub-plot of Fig. 4 is obtained by a nonlinear curve fitting procedure according to equation (20) in the paper. One can see that our proposed ESIM has a ‘tighter’ (thus, better) curve fitting, compared with that of other IQA models.
Download
We have decided to make the data set available to the research community free of charge. You can download the image database as well as the supporting file. If you use these images in your research, we kindly ask that you reference this website and our paper listed below.
Zhangkai Ni, Lin Ma, Huanqiang Zeng, Jing Chen, Canhui Cai, Kai-Kuang Ma, "ESIM: Edge Similarity for Screen Content Image Quality Assessment", IEEE Transactions on Image Processing, vol. 26, no. 10, pp. 4818-4831, Oct. 2017. Paper | Code | BibTex
@article{ni2017esim,
	title={ESIM: Edge similarity for screen content image quality assessment},
	author={Ni, Zhangkai and Ma, Lin and Zeng, Huanqiang and Chen, Jing and Cai, Canhui and Ma, Kai-Kuang},
	journal={IEEE Transactions on Image Processing},
	volume={26},
	number={10},
	pages={4818--4831},
	year={2017},
	publisher={IEEE}
}
You can download the SCID as well as the supporting file via the OneDrive: Download SCID
References
ESIM |
Z. Ni, L. Ma, H. Zeng, J. Chen, C. Cai, and K.-K. Ma, "ESIM: Edge Similarity for Screen Content Image Quality Assessment," IEEE Transactions on Image Processing, vol. 26, no. 10, pp. 4818-4831, June 2017. Paper |
SCID |
Z. Ni, L. Ma, H. Zeng, J. Chen, C. Cai, and K.-K. Ma, "ESIM: Edge Similarity for Screen Content Image Quality Assessment," IEEE Transactions on Image Processing, vol. 26, no. 10, pp. 4818-4831, June 2017. Database |
SSIM |
Z. Wang, A. C. Bovik, H. R. Sheikh, and E. P. Simoncelli, "Image Quality Assessment: From Error Visibility to Structural Similarity," IEEE Transactions on Image Processing, vol. 13, no. 4, pp. 600-612, Apr. 2004. Paper |
MSSIM |
Z. Wang, E. P. Simoncelli, and A. C. Bovil, "Multi-scale Structural Similarity for Image Quality Assessment," IEEE Conference on Signals, Systems and Computers, vol. 2, pp. 1398–1402, November 2003. Paper |
IWSSIM |
Z. Wang, Q. Li, "Information Content Weighting for Perceptual Image Quality Assessment," IEEE Transactions on Image Processing, vol. 20, no. 5, pp. 1185-1198, Apri. 2011. Paper |
VIF |
H. R. Sheikh, A. C. Bovik, "Image Information and Visual Quality," IEEE Transactions on Image Processing, vol. 15, no. 2, pp. 430-444, Feb. 2006. Paper |
IFC |
H. R. Sheikh, A. C. Bovik, and G. de Veciana, "An Information Fidelity Creation for Image Quality Assessment Using Natural Scene Statistics," IEEE Transactions on Image Processing, vol. 14, no. 12, pp. 2117– 2128, December 2005. Paper |
MAD |
E. C. Larson, D. M. Chandler, "Most Apparent Distortion: Full-Reference Image Quality Assessment and the Role of Strategy," Journal of Electronic Imaging, vol. 19, no. 1, Jan. 2010. Paper |
FSIM |
L. Zhang, L. Zhang, X. Mou, and D. Zhang, "FSIM: A Feature Similarity Index for Image Quality Assessment," IEEE Transactions on Image Processing, vol. 20, no. 8, pp. 2378-2386, Aug. 2011. Paper |
ES |
X. Zhang, X. Feng, W. Wang, and W. Xue, "Edge Strength Similarity for Image Quality Assessment," IEEE Signal Processing Letters, vol. 20, no. 4, pp. 319–322, April 2013. Paper |
GSIM |
A. Liu, W. Lin, and M. Narwaria, "Image Quality Assessment Based on Gradient Similarity," IEEE Transactions on Image Processing, vol. 21, no. 4, pp. 1500-1512, Apr. 2012. Paper |
GMSD |
W. Xue, L. Zhang, X. Mou, and A. C. Bovik, "Gradient Magnitude Similarity Deviation: A Highly Efficient Perceptual Image Quality Index," IEEE Transactions on Image Processing, vol. 23, no. 2, pp. 684-695, Feb. 2014. Paper |
VSI |
L. Zhang, Y. Shen, and H. Li, "VSI: A Visual Saliency-Induced Index for Perceptual Image Quality Assessment," IEEE Transactions on Image Processing, vol. 23, no. 10, pp. 4270-4281, Oct. 2014. Paper |
SCQI |
S. Bae and M. Kim, "A Novel Image Quality Assessment with Globally and Locally Consilient Visual Quality Perception," IEEE Transactions on Image Processing, vol. 25, no. 5, pp. 2392–2406, April 2016. Paper |
SIQM |
K. Gu, S. Wang, G. Zhai, S. Ma, and W. Lin, "Screen Image Quality Assessment Incorporating Structural Degradation Measurement," IEEE International Symposium on Circuits and Systems, pp. 125-128, May 2015. Paper |
EMSQA |
Z. Ni, L. Ma, H. Zeng, C. Cai, and K.-K. Ma, "Screen Sontent Image Quality Assessment Using Edge Model," IEEE International Conference on Image Processing, pp. 81–85, August 2016. Paper |
Contact
If you have any questions, please feel free to contact Dr. Zhangkai Ni .
Last update: Oct. 7, 2018